Background
A receiver function (RF) is the response of the Earth structure below a seismometer to an incident seismic wave and consists of a series of P-to-S (Ps) or S-to-P (Sp) converted waves generated at structural interfaces, mainly those generated by the velocity discontinuities in the crust and upper mantle below the seismometer. Crustal thickness (H) and P-wave and S-wave velocity ratio (κ) are important parameters to control the RFs features. These two parameters can reflect the crustal structure and internal material composition. They can provide an essential basis for regional tectonics and dynamics. Here, we want to develop a pattern recognition method to extract the H and κ from RFs. In a way, this is an inversion problem.
We provide synthetic data obtained through forward modeling, which can be used as training and test datasets. Real data is also provided and can be seen as an application. Of note, for real data, we are unsure what the real H and κ are under the ground because no one can “drill” into the Earth. However, we provide the results of H and κ results by predecessors through traditional methods, which can be used as a reference.
Data
Training dataset
- Data: Train_RF60000_73_500.dat
- Data: Orig_train_RF60000_73_500.dat
- Size: 6000050073
Label of the training dataset
- Data: Hk60000_1050.dat
- Size: 6000010501 (combined with two Gaussian distributions)
Test dataset
- Data: RF10000_73_500.dat
- Data: Orig_RF10000_73_500.dat
- Size: 1000050073
Label of the test dataset
- Data: Hk10000_1050.dat
- Size:1000010501 (combined with two Gaussian distributions)
Real data
- Real receiver functions from 38 stations distributed in the mainland of China.
- Size: 500*73
Additional Instruction
- The real data comes from Li et al. (2019), which can be used as a reference to compare your method’s results.
- One can use dataloader.py to plot the RF(data) and Hk(label).
- There are two datasets for the training process named RF60000_73_500.dat and Orig_RF60000_73_500.dat. The first is masked and noise-augmented data on the Orig dataset. This is to simulate real data to apply your method to the actual real data. One can directly use the first dataset or rebuild the dataset based on the Orig dataset after figuring out the features of real data.
Grading
- Performance on the test dataset (30 Points)
- Performance on the real data compared to Li et al. (2019) (Bonus, 10 Points)
Evaluation criteria on the real data:
- number of stations > 30, dH < 10%.
- number of stations > 30, dk < 5%.
$dH=H’/H, dk=k’/k$, where $H’$ and $k’$ are prediction of your learning method. $H$ and $k$ are the results of Li et al. (2019).
Example
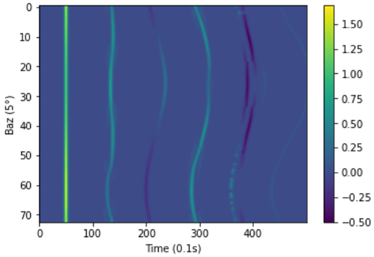
Original RF
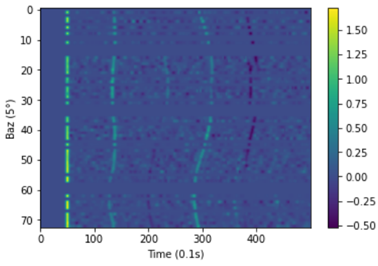
Simulated RF
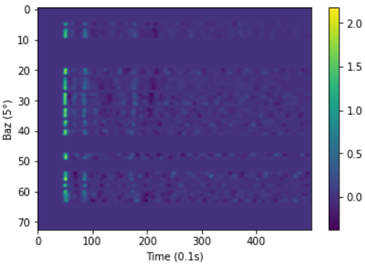
Real data
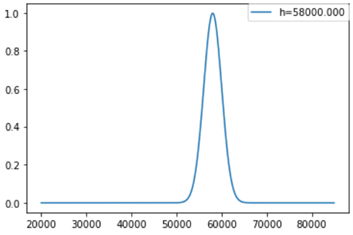
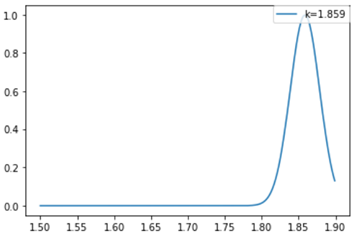
$Hk$
Downloads
Data and code: GDrive
Reference
Li, Jiangtao, et al. “A generalized H‐κ method with harmonic corrections on Ps and its crustal multiples in receiver functions.” Journal of Geophysical Research: Solid Earth 124.4 (2019): 3782-3801. [pdf]