Motivation
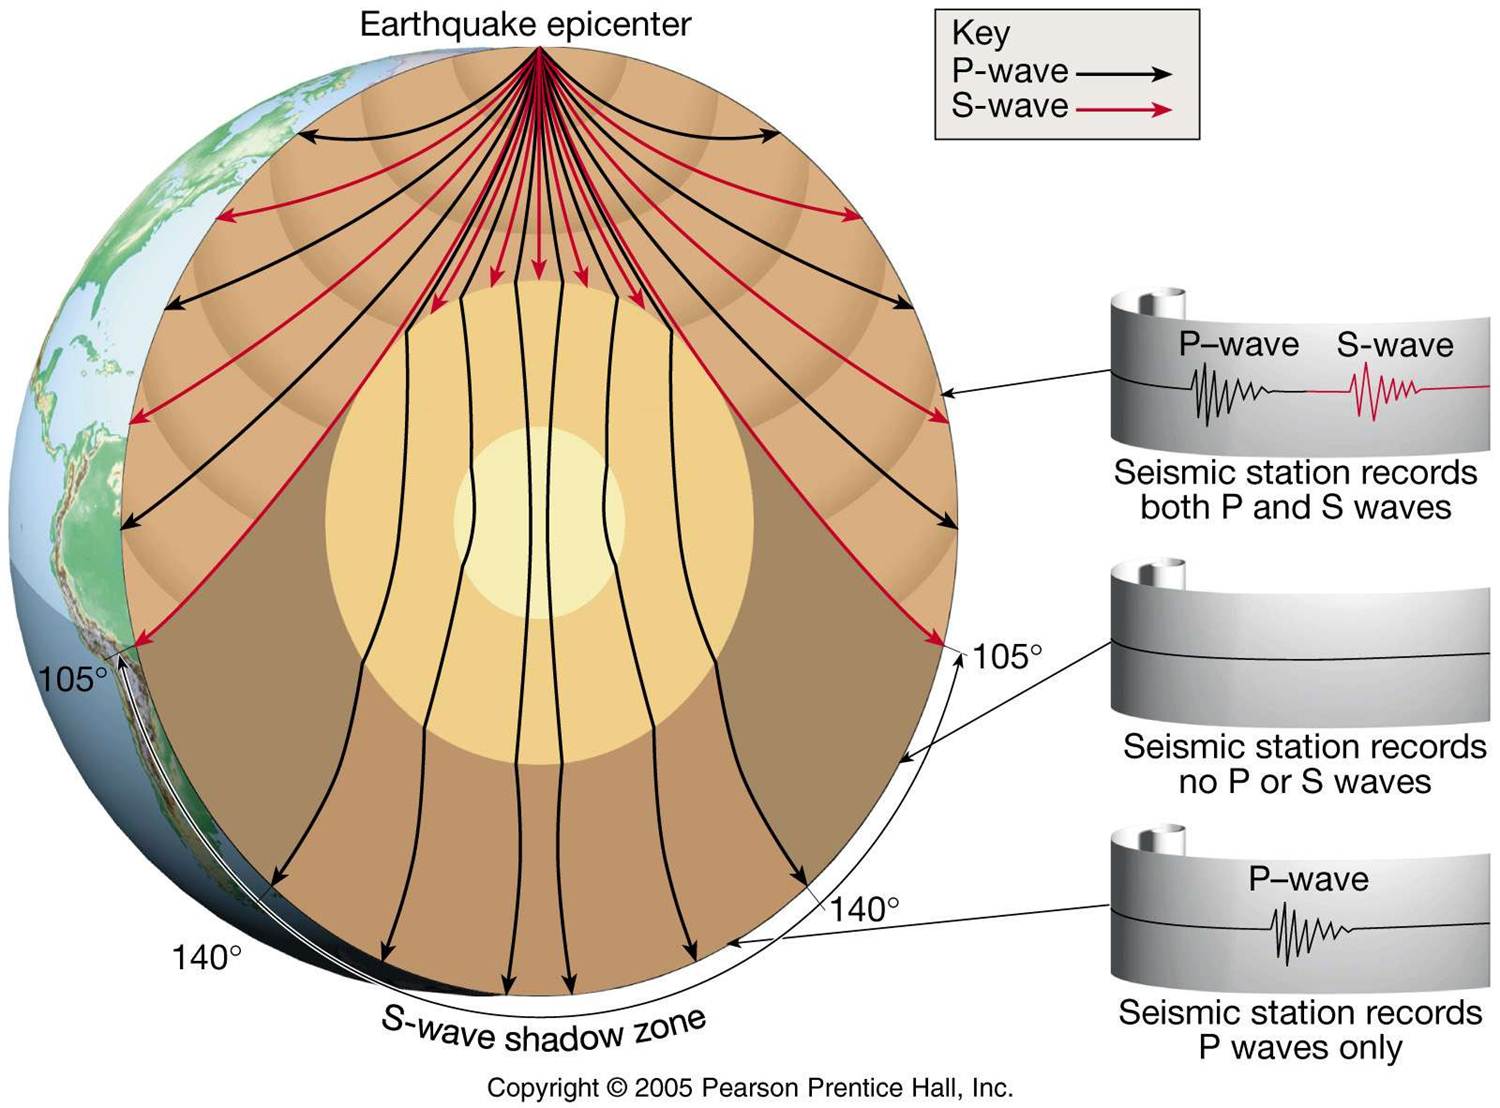
After the occurrence of an earthquake, data recorded by worldwide stations are usually used to locate the earthquake and construct the earthquake catalog for further research and earthquake disaster evaluation (Figure 1). An accurate earthquake catalog is the foundation of seismology, which largely depends on the number and accuracy of arrival time measurements.

Data

INSTANCE (Michelini et al., 2021; webpage) is a dataset of seismic waveforms and associated metadata. It includes 54,008 earthquakes for 1,159,249 3-component waveforms and 132,330 3-component noise waveforms from 620 seismic stations.
See dataset.ipynb script for additional details on data reading, etc.
The phase-picking task
Input
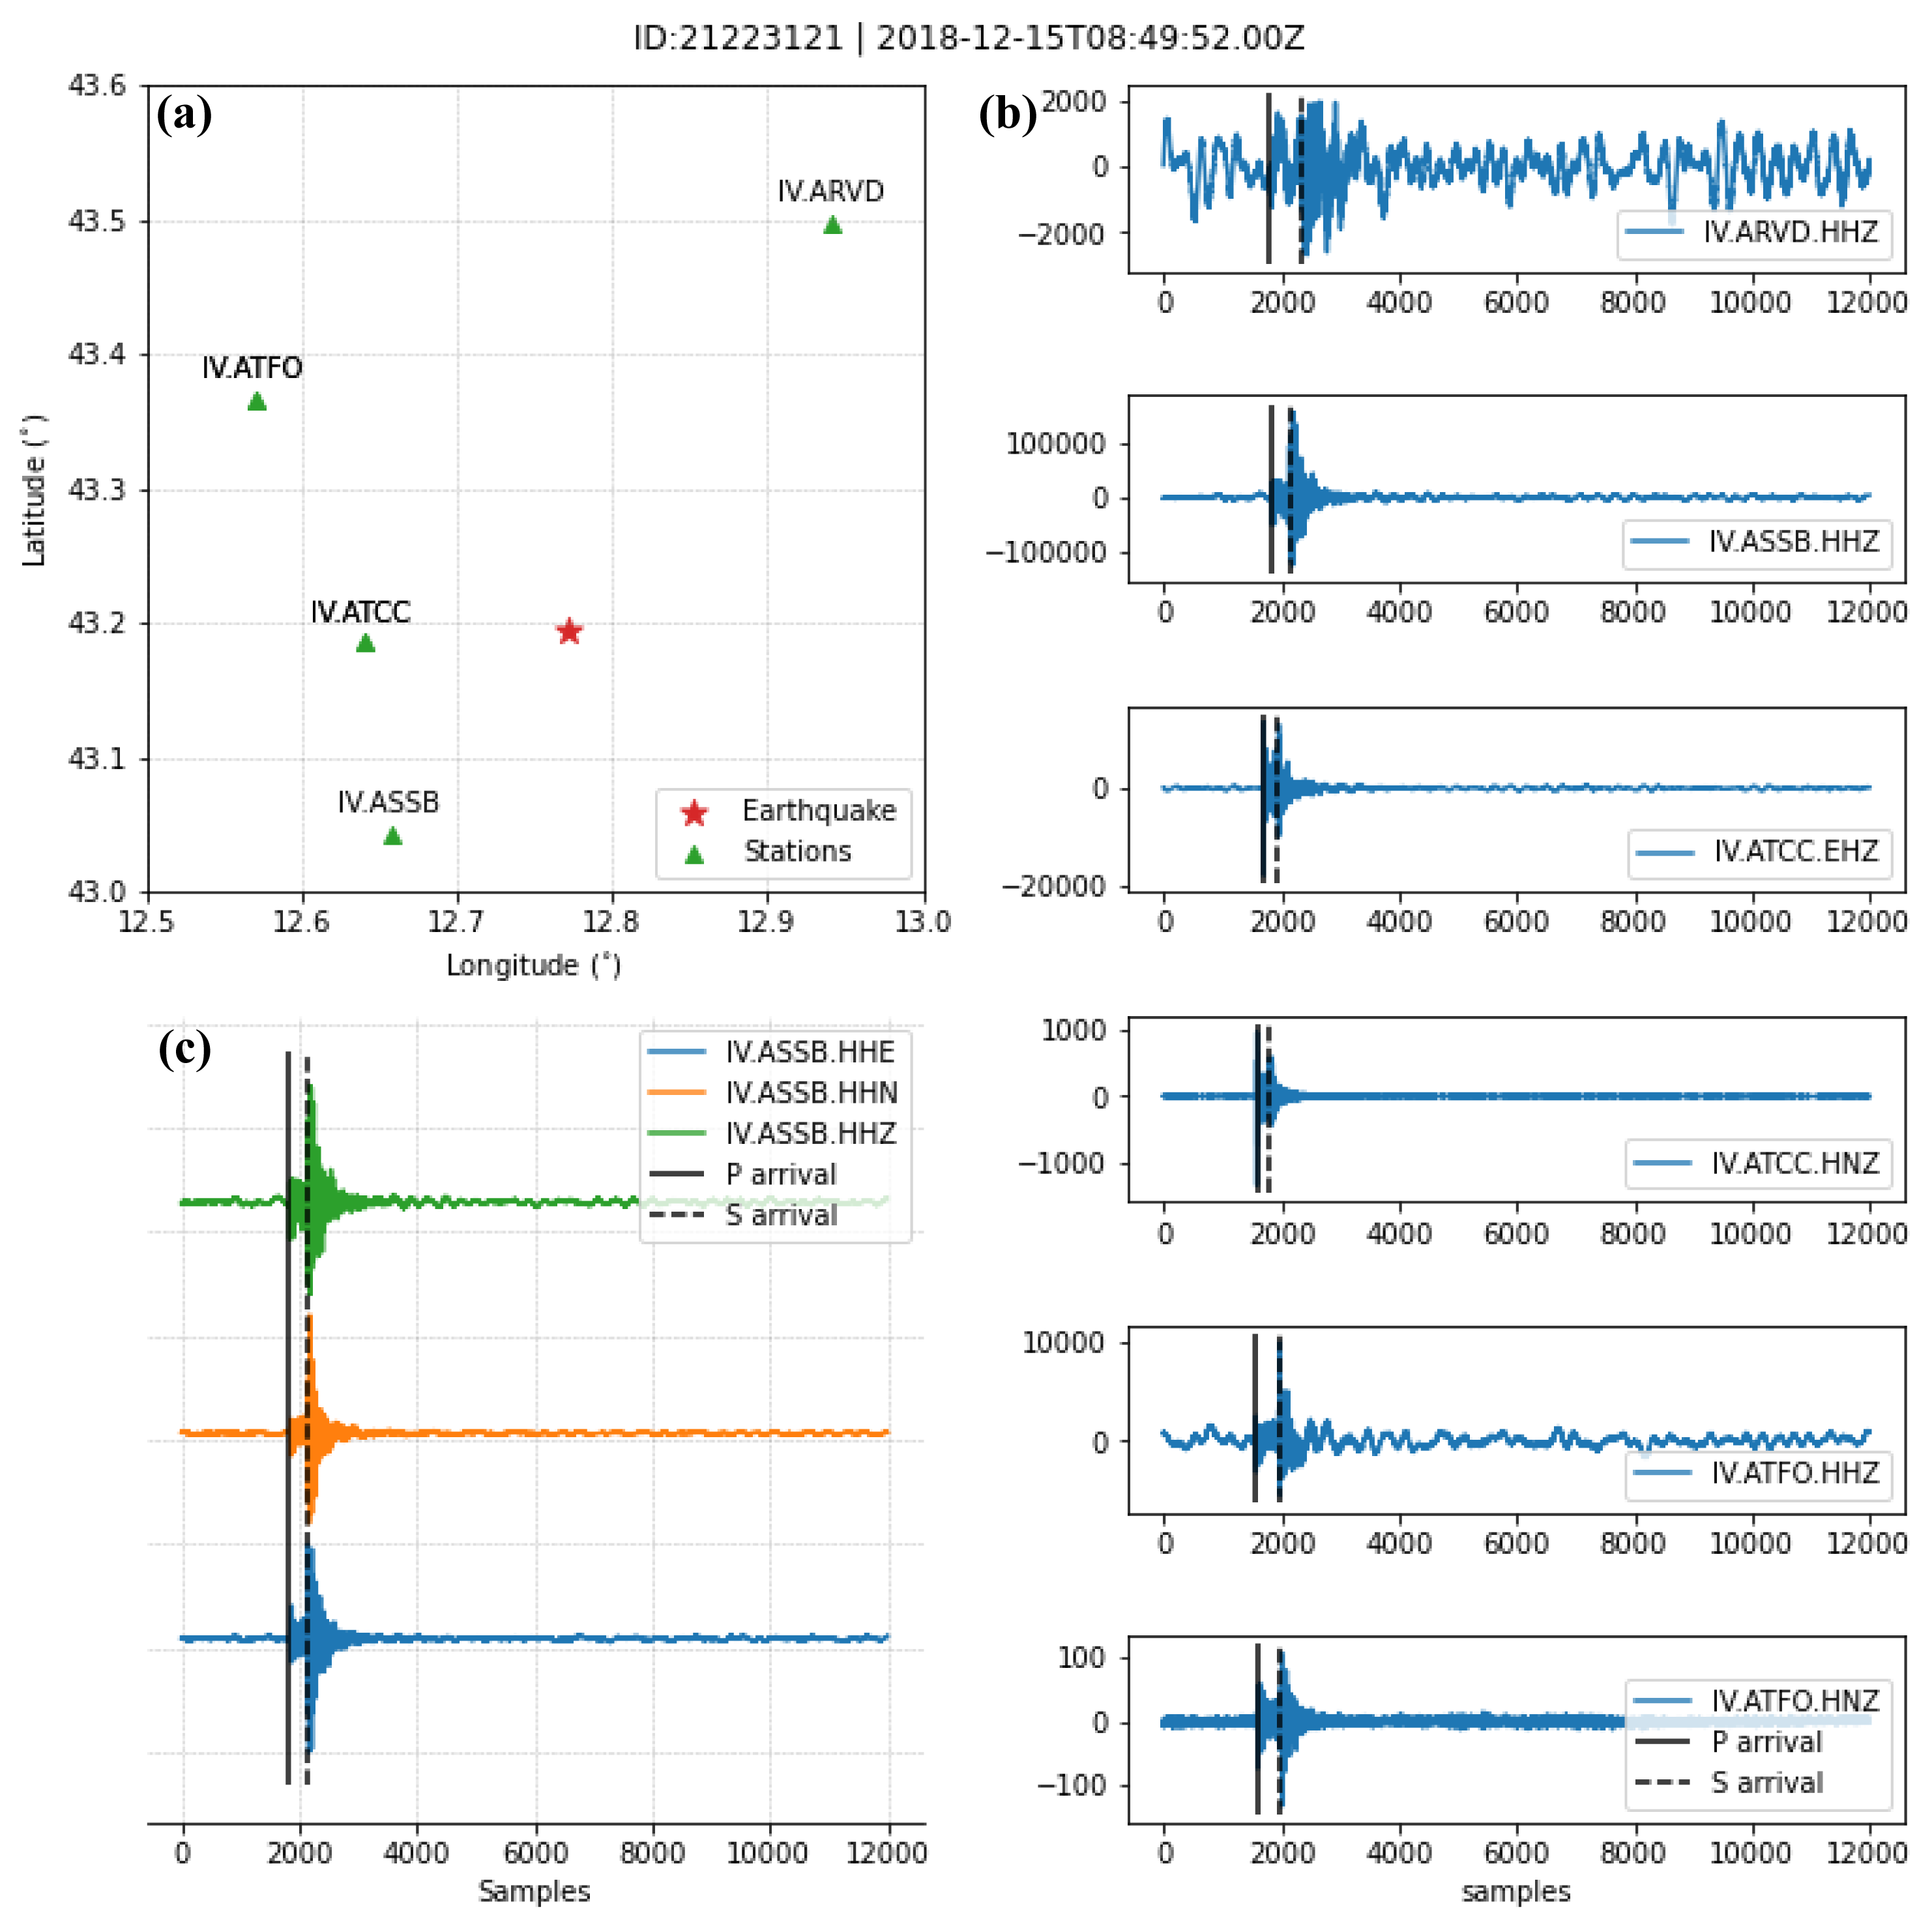
The input data is the earthquake waveforms recorded by stations (Figure 3b,c). These data all have a uniform length - 12,000 samples (120 seconds with 100 Hz sampling rate). The dataset provides P-wave arrivals and S-wave arrivals for each waveform data, which are manually selected or obtained according to a reliable procedure.
Prediction
The prediction is the P-wave arrival and S-wave arrival based on waveforms. Note that the seismic signal may only be present in some waveform data; some subsets may not have P- and S-wave arrivals.
Metrics
| metrics | description | formula |
|---|---|---|
| $\mu$ | mean of error (ground truth, prediction) | |
| $\sigma$ | standard deviation of the error (ground truth, prediction) | |
| $Pr$ | precision | $Pr=\frac{T_p}{T_p+F_p}$ |
| $Re$ | recall | $Re=\frac{T_p}{T_p+F_n}$ |
| $F1$ | F1 score | $F_1=2\cdot\frac{Pr\times Re}{Pr+Re}$ |
| … |
$T_p$ is the number of true positives, $F_p$ is the number of false positives, and Fn is the number of false negatives. Peak probabilities above 0.5 are counted as positive picks. Arrival-time residuals that are less than $0.1 s (\Delta t < 0.1 s)$ are counted as true positives.
Grading
We divided the entire problem into four steps. The first two steps are basic problems, whereas the rest two steps are bonus problems.
1. Build training set (10 points)
As supervised learning, you need to construct data-label pairs. However, constructing effective labels is challenging.
First, as the dataset only provides expert-labeled P-wave and S-wave arrival times, you need to consider how to use these two expert-labeled times in the training. Of note, expert opinions may differ slightly so that the labels can be regarded as “fuzzy.”
Second, the arrival time has uncertainty; we cannot study these two arrivals as precise numbers. A simple consideration is that the labels are consistent with the waveform data, but are non-zero near the arrival and zero everywhere else (Figure 4). Of course, you can also have other choices.

You can test different labels using Gaussian functions, triangular, box function, or any filtering functions to represent arrival time.
To-do list:
- 1.1 Download data
- 1.2 Design waveforms window Tips: The length of the original waveform data is 12000. You are free to set the waveform window used for training, but the waveform window must contain P wave and S wave time.
- 1.3 Design labels As mentioned above, you can choose gaussian, triangle, box function, or others.
- 1.4 Build a data loader based on single-trace Single-trace refers to the data obtained from a single station.
- 1.5 Use a traditional method and analyze the performance We used the open-source “AR picker” (Akazawa 2004) implemented in Python (Obspy) (Beyreuther et al. 2010). You can randomly select part of the data and use AR picker to pick the P and S arrival times. See more info in
dataset.ipynb.
2. Single-trace phase-picking (20 points)
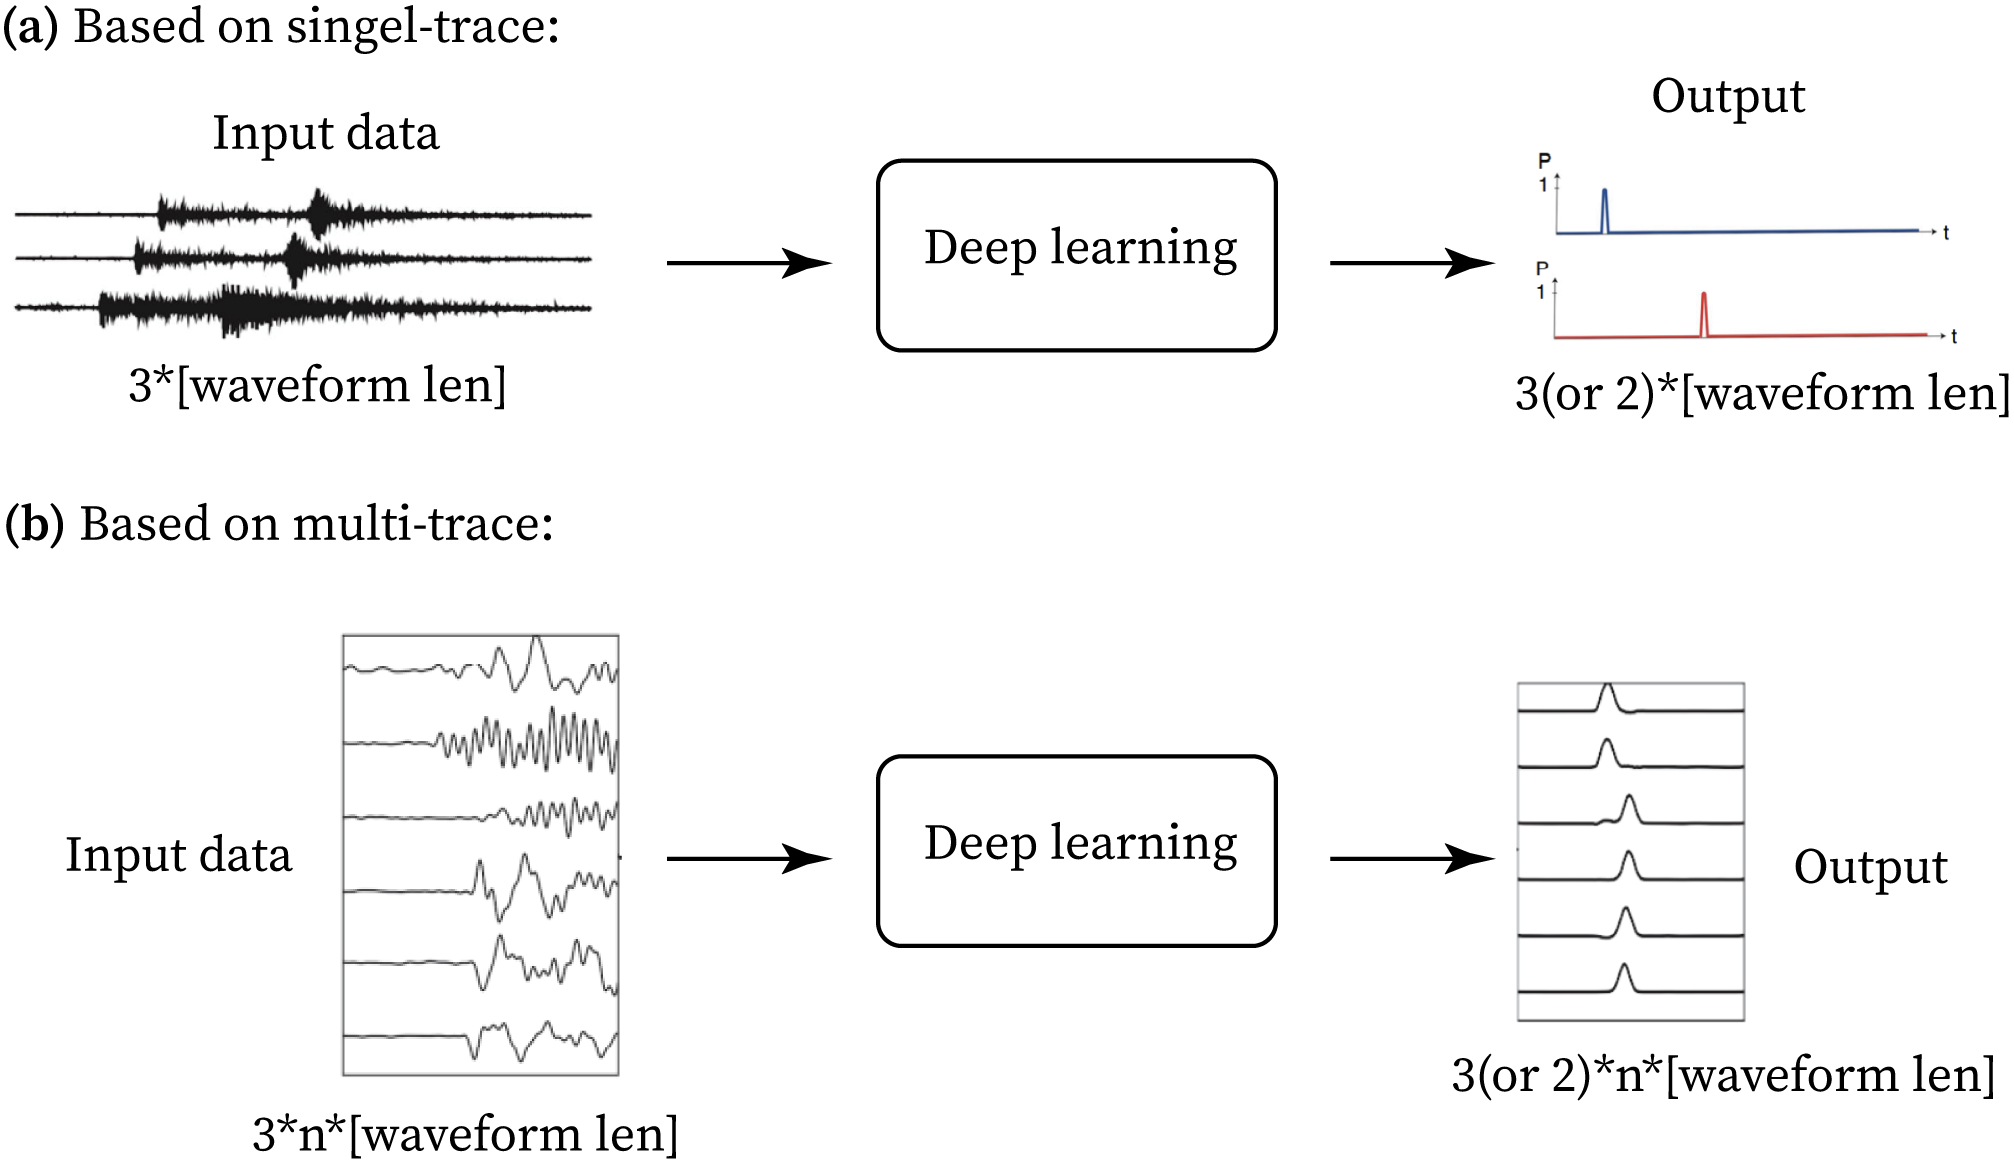
Fig 5. Diagrams of two types of phase-picking tasks. (a) Based on single-trace. The input data is the 3-component waveforms recorded by a single station. The output is the P and S arrival-time Probability distribution. The probability distribution of the noise can also be output. (b) Based on multi-trace. The input data is the 3-component waveforms recorded by n stations. The output is the same as in (a), but with n times the size.
Once you have finished the first step, you can use the waveform data–label pair for supervised learning (Figure 4a). The performance should be evaluated on the test set.
To further improve generalization, remember to add pure noisy data for training. Again, single-trace means 3-component (E, N, Z, East, North, Vertical) waveforms at a station. Hence, the data size is 3*12000, and the label is 2*12000.
To-do list:
- 2.1 Design the learning method
- 2.2 Test different labels and waveform lengths These ablations would help improve performance while saving time.
- 2.3 Use all the data to train with the best-performing label and waveform length
- 2.4 Analyze the performance
metrics P-pick S-pick $\mu$ $\approx 0s$ $\approx 0s$ $\sigma$ $<0.2s$ $<0.5s$ $Pr$ $>0.9$ $>0.9$ $Re$ $>0.9$ $>0.9$ $F1$ $>0.9$ $>0.9$ The above table shows the testing performance of existing works (PhaseNet, Zhu et al., 2019; EQTransformer, Mousavi et al., 2020). These numbers are provided for reference.
3. Multi-trace phase-picking (bonus, 20 points)
If you have completed the above task of single-trace, your next goal is to combine multiple waveform data (like videos) for learning (Figure 4b).
A simple idea is to integrate waveform data from the same earthquake at different stations into images and learn these images. If the same earthquake is recorded by too many stations, you can divide multiple stations into smaller sets of stations and consider it to be another earthquake, even though it is actually the same earthquake.
Because we have a priori information about the time of the earthquake and the time of the station record, try to integrate this information into the learning method. This can be very challenging but would also be very rewarding if you manage to solve it.
See background section and dataset.ipynb for more information.
To-do list:
- 3.1 Design different data loaders to incorporate multi-trace information
- 3.2 Design the learning method
- 3.3 Use all the data to train with the best-performing label and waveform length
- 3.4 Analyze the performance
- 3.5 Compare the performance with the above single-trace method
4. Application (bonus, 10 points)
Apply your method to ACTUAL Chinese network data and build EARTHQUAKE catalogs. This is further validation of the generalization and reliability of your method.
Downloads
Data and code: [GDrive] [百度盘] [北大盘]
dataset.ipynb                     # code for reading data with examples; you'll need to modify the base code (e.g., path, filename) to run some examples.
Instance_events_counts.hdf5.bz2   # waveforms dataset (bz2 compressed file)
Instance_noise.hdf5.bz2           # noise dataset (bz2 compressed file)
metadata_Instance_events_v2.csv   # metadata of waveforms
metadata_Instance_noise.csv       # metadata of noise dataset
Literature
Traditional methods
With many seismic stations, manually picking the seismic phase can not cope with a large number of station data, so the automatic picking algorithm emerged. As early as the 1970s, seismologists developed the automatic phase-picking algorithm based on single-trace waveform data. These early works are defined as the traditional methods in this project, including STA/LTA (Allen, 1978), kurtosis and skewness (e.g., Ross and Ben-Zion, 2014), and the mixture of the above methods (AR picker, Akazawa, 2004; PALM, Zhou et al., 2021). These methods, while improving efficiency, do not always match the accuracy of manual pickups (for example, due to noise).
The traditional algorithm is primarily based on waveform data (one-dimensional time series) and determines the arrival time based on the jump of the waveform.
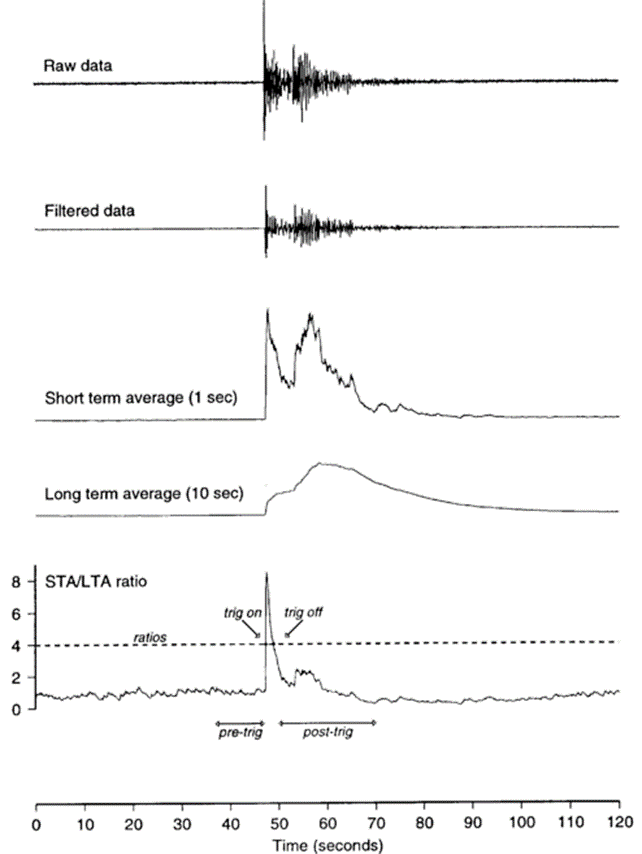
Fig 6. Examples of STA/LTA method, where short-term averaging and long-term averaging can be calculated using the envelope or variance of the waveform and other characteristic functions.
Learning-based methods
Several works on phase picking based on machine learning methods have recently emerged. Mousavi et al. (2020) conducted a comparative study on several deep learning networks and summarized the current development. The following three networks are considered the best-performing networks in the paper. Of note, the recent research on seismic phase-picking is mainly based on single waveform data, while the waveform data of adjacent stations are significantly correlated. Therefore, the current development trend is from single-trace to multi-trace picking.
- DetNet+PpkNet (Zhou et al., 2019)
The network is divided into two parts: the seismic detection network DetNet and the phase picking network PpkNet.
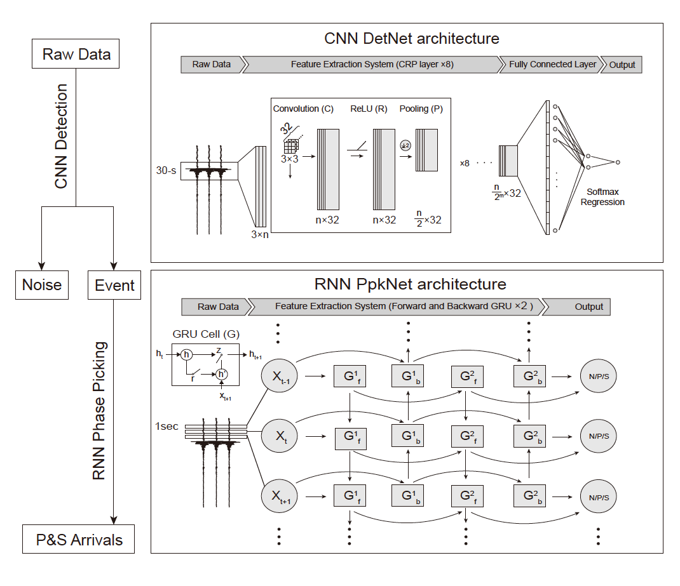
Fig 7. Seismic detection network based on CNN and phase-picking network based on RNN.
- PhaseNet (Zhu et al., 2018)
Zhu et al. adapted the medical U-net to the seismic phase-picking task.
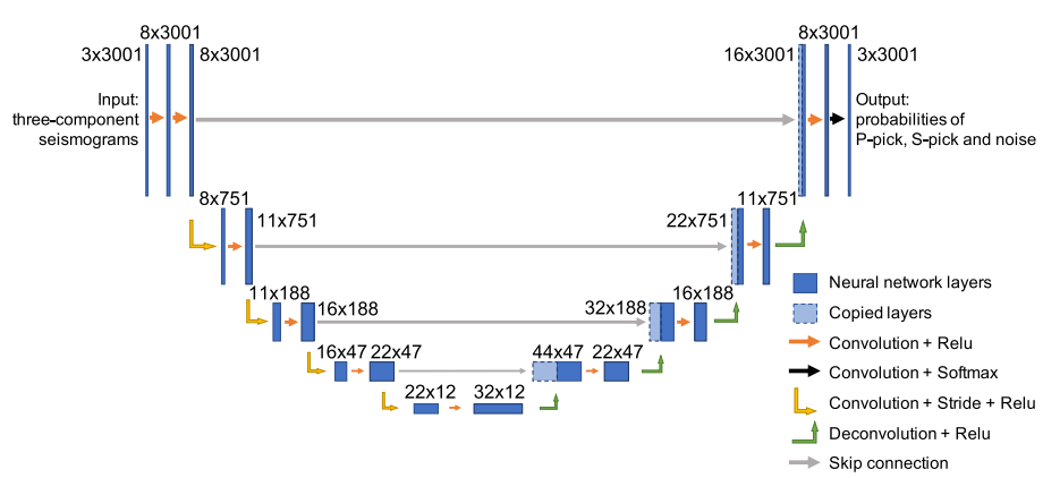
Fig 8. The network architecture.
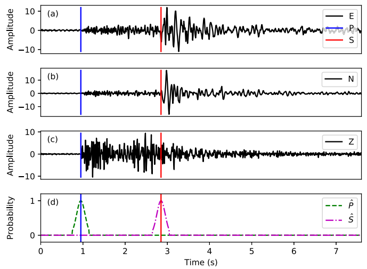
Fig 9. A sample from the data set. (a) – (c) Seismograms of the “ENZ” (East, North, Vertical) components. The blue and red vertical lines are the manually picked P and S arrival times. (d) The converted probability masks for P and S picks. The shape is a truncated Gaussian distribution with a mean (μ) of the arrival time and a standard deviation (σ) of 0.1 s. (Zhu et al., 2018)
- EQtransformer (Mousavi et al., 2020)
Mousavi et al. introduced the attention mechanism and designed it as a multitasking network.
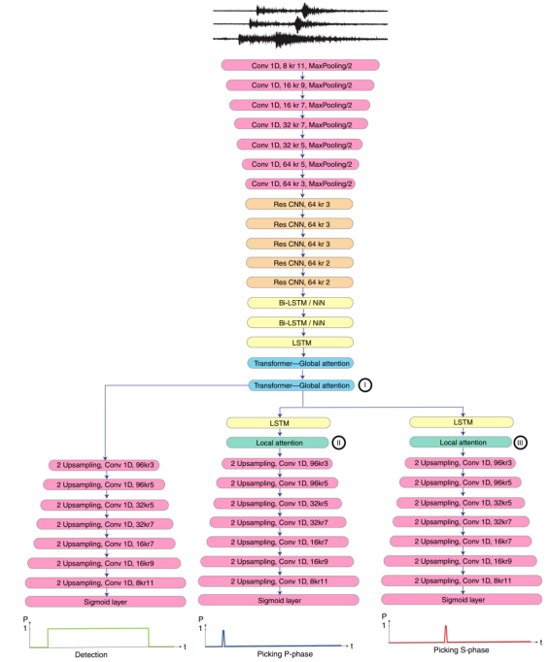
Fig 10. Network architecture.
- Current multi-traces phase picking works
The phase-picking based on the single-trace approach is already comparable to human manual accuracy in the dataset. The current research trend is to move towards multi-channel picking.
4.1 CubeNet: Chen et al., 2022
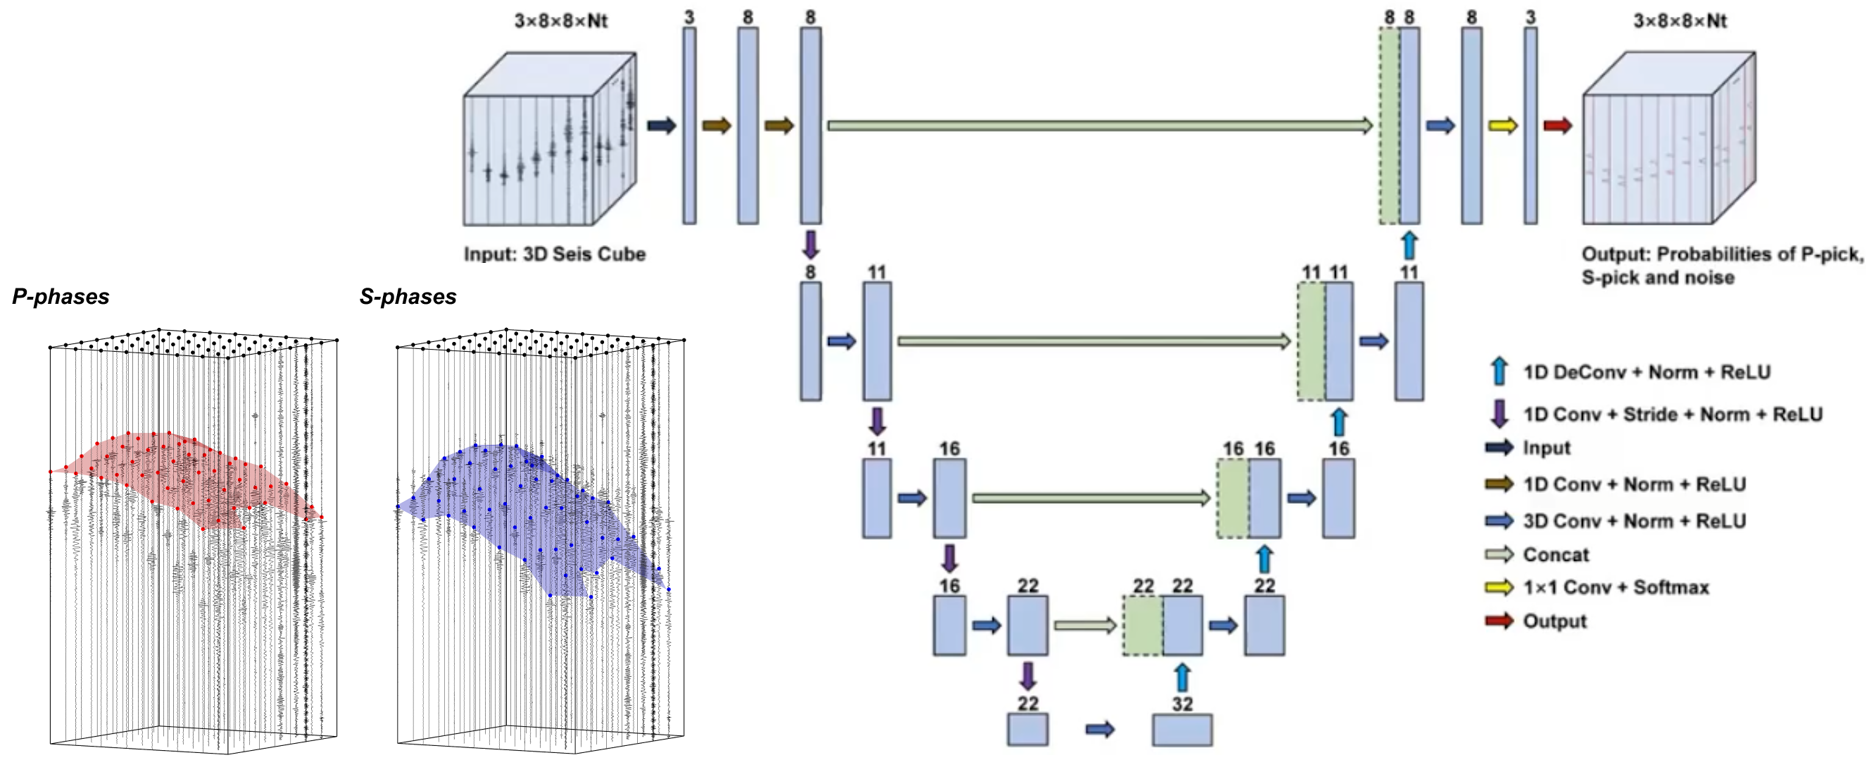
Fig 11. The network architecture and the form of data used. The study area is divided into grids, and station data from the same grids are combined into data bodies for training and prediction.
4.2 EdgePhase: Feng et al., 2022 in revision
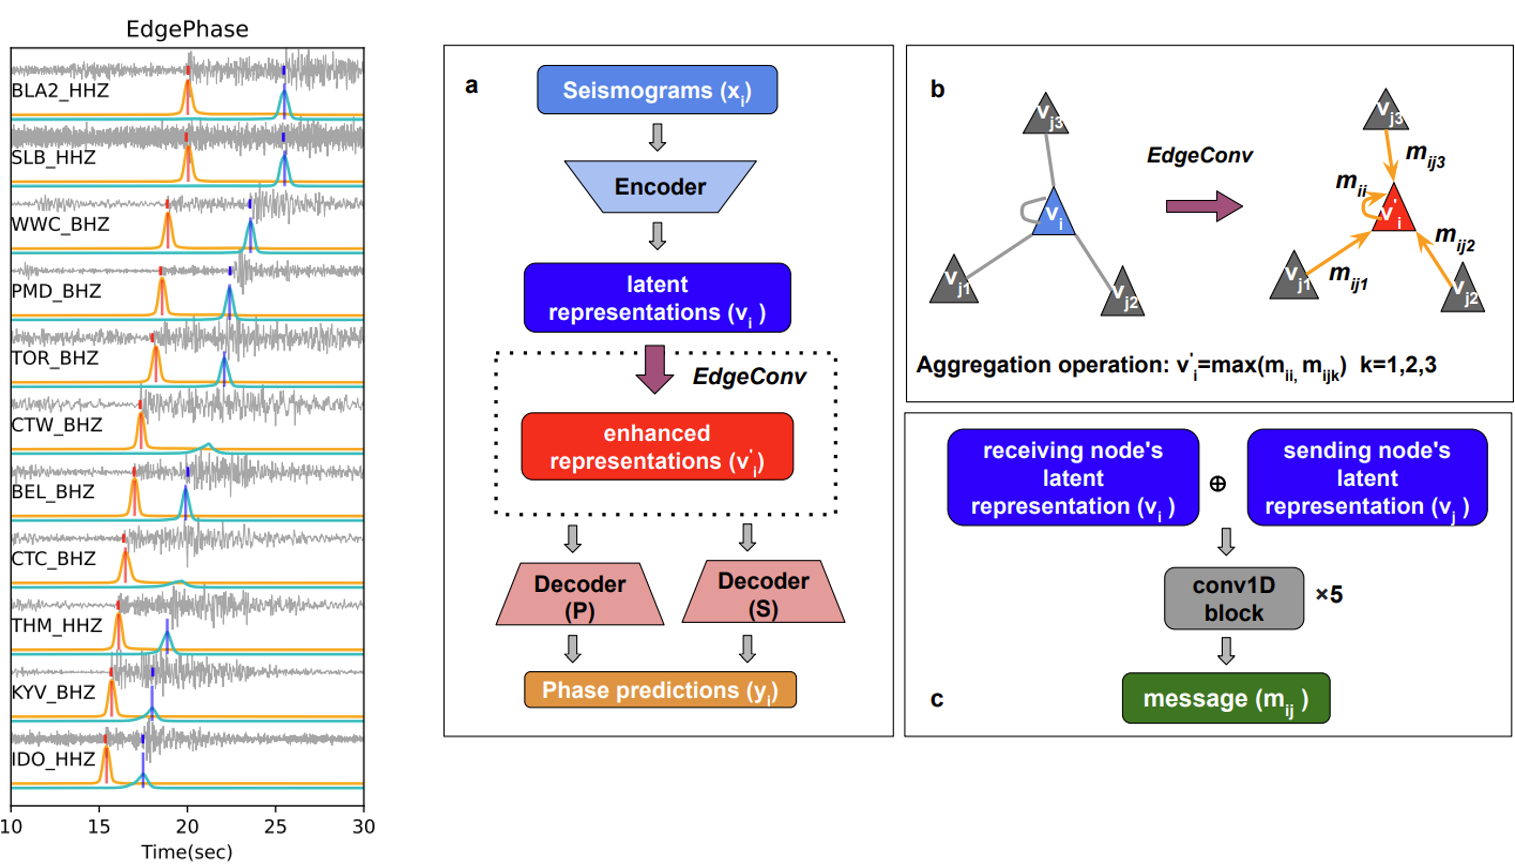
Fig 12. Network architecture and example of phase picking.
Public seismic dataset
Publicly available seismic datasets (Zhao et al., 2022).
| Dataset | Earthquake seismogram | Noise seismogram | Waveform length | Region | Institution |
|---|---|---|---|---|---|
SCEDC, 2013- | 8.1M | U.S. |  | ||
STEAD, 2019 | 1.05M | 0.1M | 60s | Global |  |
LEN-DB, 2020 | 0.63M | 0.62M | 27s | Global |  |
NEIC, 2020 | 1.03M | 0 | 60s | Global |  |
INSTANCE, 2021 | 1.2M | 0.13M | 120s | Italy |  |
DiTing (谛听) 2022 | 2.73M | 0 | 180s | China |  |
bz2 compressed files can be extracted by 7zip.
References
Traditional methods
- Akazawa. 2004. Technique for automatic detection of onset time of P- and S-phases in strong motion records in 13th World Conference on Earthquake Engineering, Vancouver, 786: 786.
- Allen RV. 1978. Automatic earthquake recognition and timing from single traces. Bull. seism. Soc. Am., 68(5): 1521–1532, DOI: 10.1785/BSSA0680051521.
- Ross ZE, Ben-Zion Y. 2014. Automatic picking of direct P, S seismic phases and fault zone head waves. Geophys. J. Int., 199(1): 368–381, doi: 10.1093/gji/ggu267.
- Takanami T, Kitagawa G. 1991. Estimation of the arrival times of seismic waves by multivariate time series model. Ann. Inst. Stat. Math., 43(3): 407-433, DOI: 10.1007/BF00053364.
- Zhou YJ, Yue H, Fang LH, Zhou SY, Zhao L, Ghosh A. 2021. An Earthquake Detection and Location Architecture for Continuous Seismograms: Phase Picking, Association, Location, and Matched Filter (PALM). Seismol. Res. Lett., DOI: 10.1785/0220210111.
Learning-based methods
Based on single-trace:
- Mousavi SM, Ellsworth WL, Zhu WQ. et al. 2020. Earthquake transformer—an attentive deep-learning model for simultaneous earthquake detection and phase picking. Nat. Commun., 11: 3952, DOI: 10.1038/s41467-020-17591-w.
- Zhou YJ, et al., 2019. Hybrid Event Detection and Phase-Picking Algorithm Using Convolutional and Recurrent Neural Networks. Seismol. Res. Lett., 90(3), 1079-1087.
- Zhu WQ, Beroza GC. 2019. PhaseNet: a deep-neural-network-based seismic arrival-time picking method. Geophys. J. Int., 216: 261-273
Based on multi-tarce:
- Chen et al. 2022. CubeNet: Array‐Based Seismic Phase Picking with Deep Learning. Seismol. Res. Lett., 93 (5): 2554–2569.
- Feng et al. 2022, in revision. EdgePhase: A Deep Learning Model for Multi-station Seismic Phase Picking. Geochemistry, Geophysics, Geosystems.
Datasets:
- Mousavi SM, Sheng YX, Zhu WQ, Beroza GC. 2019. In Stanford Earthquake Dataset (STEAD): A Global Data Set of Seismic Signals for AI. IEEE Access. 7: 179464-179476, DOI: 10.1109/ACCESS.2019.2947848.
- SCEDC 2013: Southern California Earthquake Center. https://doi.org/10.7909/C3WD3xH1
- Magrini, Fabrizio, Jozinović, Dario, Cammarano, Fabio, Michelini, Alberto, and Boschi, Lapo. 2020. LEN-DB - Local earthquakes detection: a benchmark dataset of 3-component seismograms built on a global scale. Data set: http://doi.org/10.5281/zenodo.3648232
- NEIC: Yeck, W. L., Patton, J. M., Ross, Z. E., Hayes, G. P., Guy, M. R., Ambruz, N. B., Shelly, D. R., Benz, H. M., Earle, P. S., 2021. Leveraging Deep Learning in Global 24/7 Real-Time Earthquake Monitoring at the National Earthquake Information Center.
- Michelini, A., Cianetti, S., Gaviano, S., Giunchi, C., Jozinović, D., & Lauciani, V. 2021. INSTANCE - The Italian Seismic Dataset For Machine Learning. Istituto Nazionale di Geofisica e Vulcanologia (INGV). https://doi.org/10.13127/INSTANCE
- DiTing: Zhao M, Xiao Z W, Chen S and Fang L H. 2022. Diting: a large-scale Chinese seismic benchmark dataset for artificial intelligence in seismology. Earthq Sci 35.
Tools
- **Beyreuther, M., Barsch, R., Krischer, L., Megies, T., Behr, Y., and Wassermann, J., 2010. ** ObsPy: A Python Toolbox for Seismology. Seismological Research Letters, 81 (3), 530-533. http://www.seismosoc.org/publications/SRL/SRL_81/srl_81-3_es/