Background
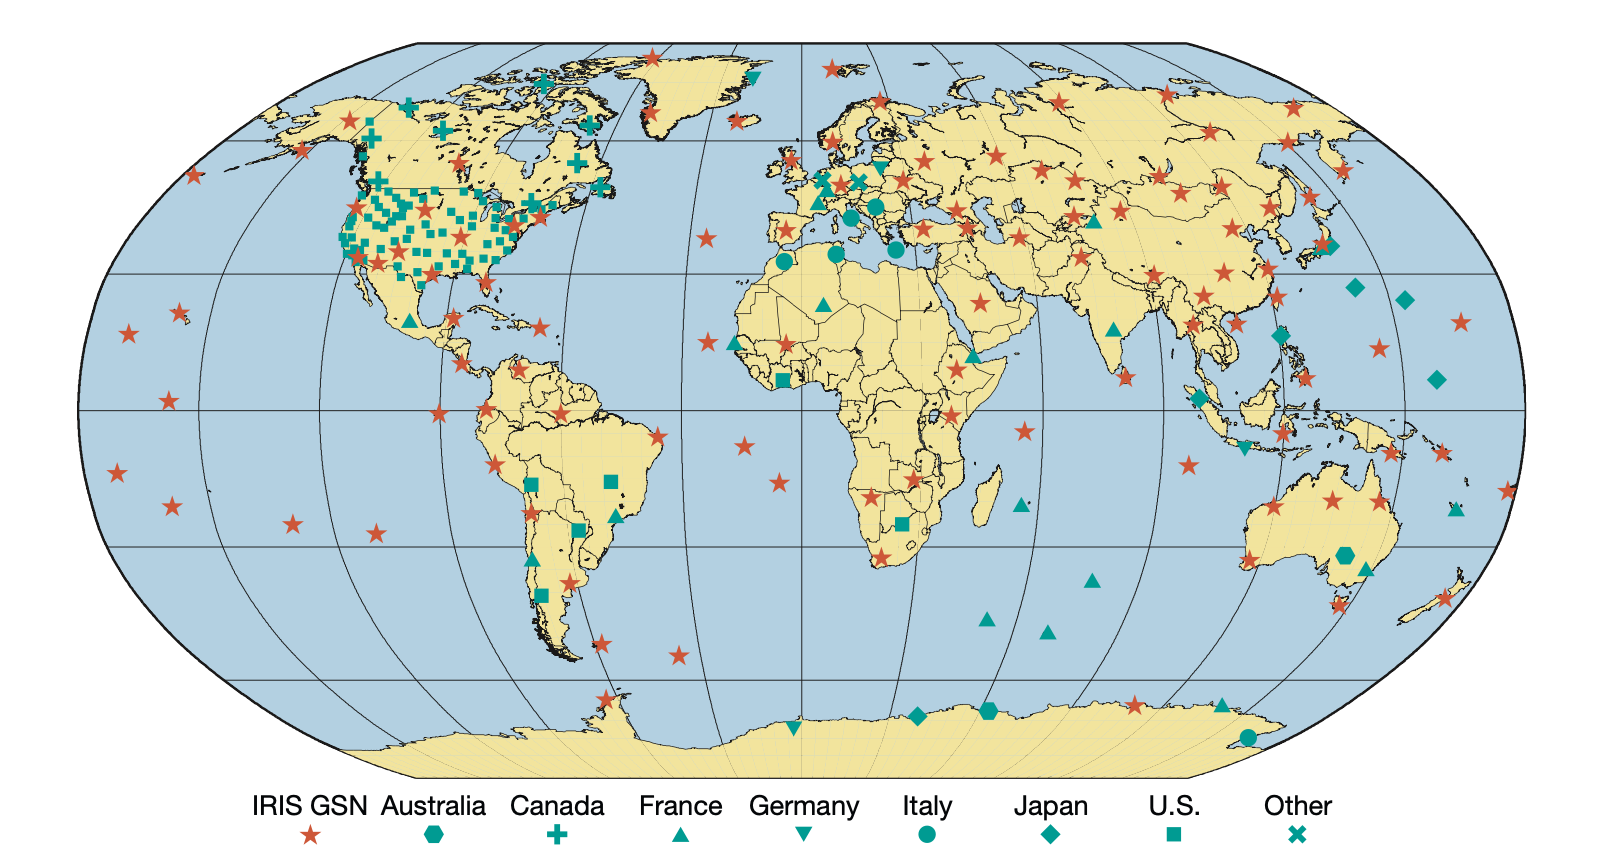
Global Seismographic Network (GSN) is deployed worldwide to listen to the sound of the Earth. The recorded signals, also referred to as seismograms, contains rich information on the environmental processes, seismic hazard, and could also be used to monitor human activities.
Most energies of the recorded signals come from Earthquakes, which have been widely analyzed by earthquake physicists. Earthquake physicists found that most earthquakes can be generalized into simple physical models, and a few parameters can nicely parameterize the earthquakes. Such global earthquake catalogs are available at https://www.globalcmt.org/.
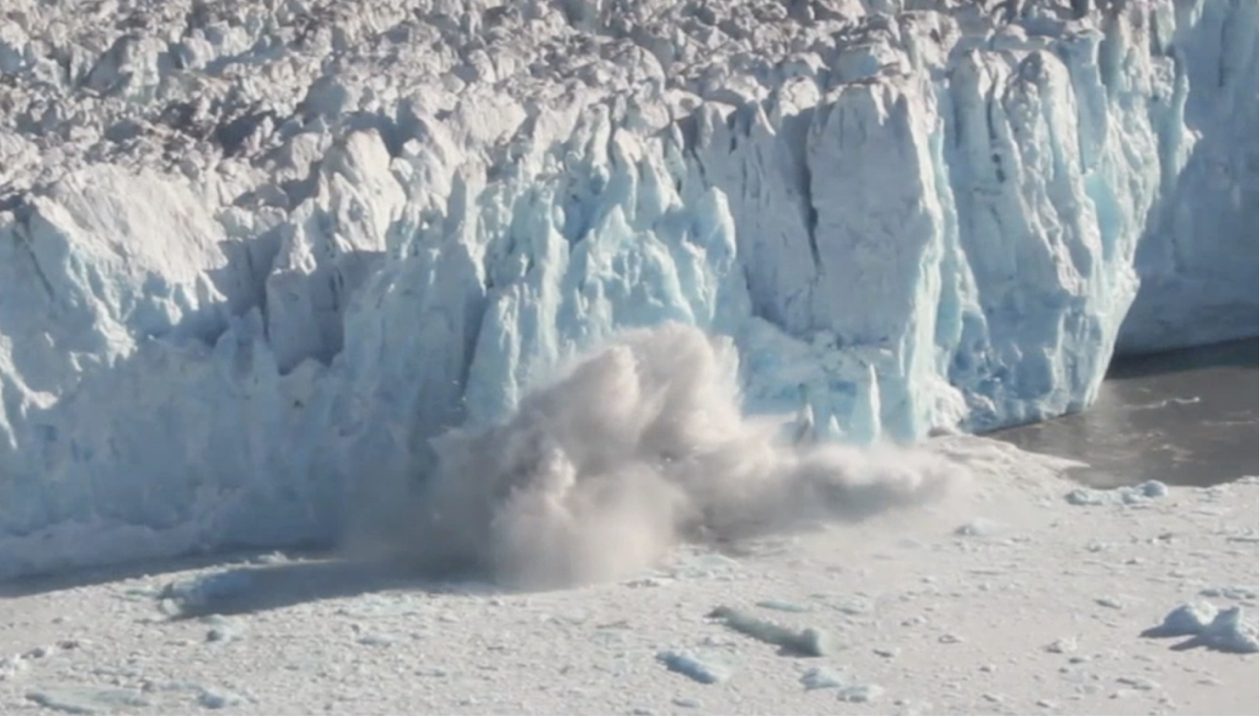
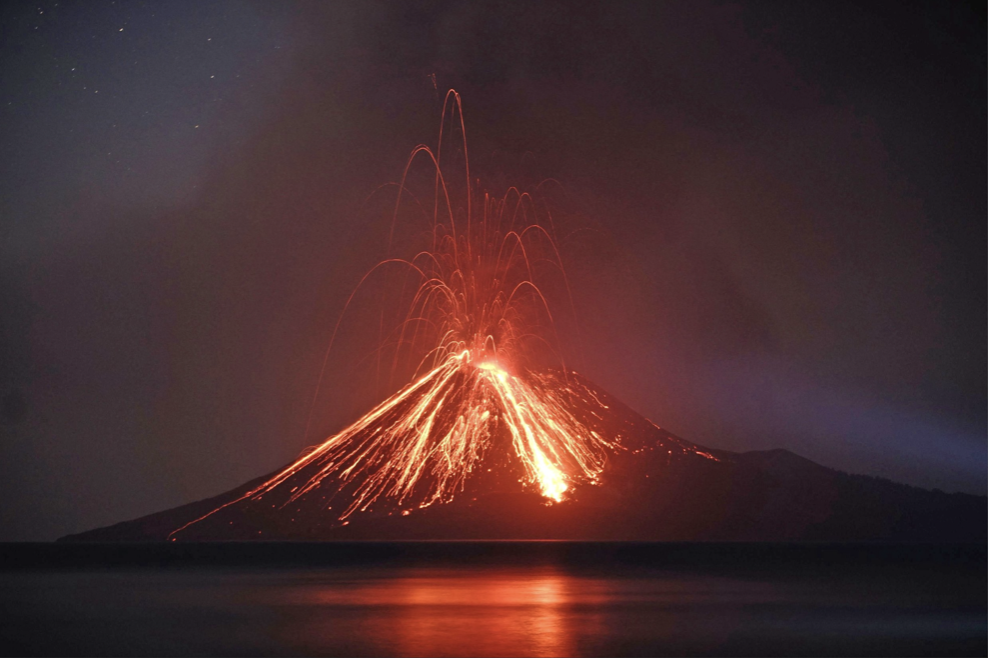
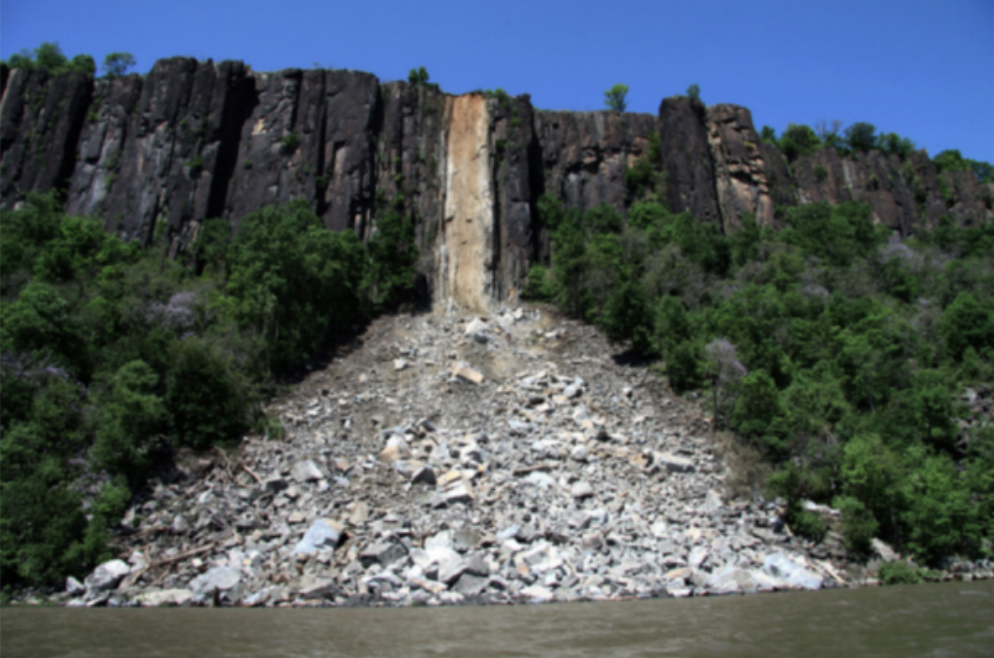
However, there are still many sources (other seismic events) that are pretty complicated and hard to parameterize by the simple normal earthquake sources. The cause of these unusual seismic events may include glacial calving, volcano eruption, and landslides (see figures below).
Data format & data Loader
We provide two types of data formats (MiniSEED file and binary file) for you to analyze. Please see the python notebook “dataloader.ipynb” for an example data loading process.
- MiniSEED format. MiniSEED file is a waveform data format commonly used by the seismology community. Some well-developed modules (i.e., obspy) are handy for further analysis of the waveform data, i.e., plotting waveform, filtering, and manipulating the data.
- Binary format. If you are less interested in the seismological background and just keen to directly apply the machine learning method to the raw data, the binary data would be the best way to get started. The binary data of each event is formed by a Numpy 2D array (129x7200 size, dtype=“float64”). Vertical indices indicate the index number of the GSN station (129 stations in total, for detailed station code and location parameters, please see “Stations_FULL.txt”), horizontal indices represent the time series of the seismogram waveform data (The sampling rate is fixed at one data point per second, and each trace contains 7200 data points, thus recording 7200 second = 2 hours long). The waveform data has been filtered between 20s to 150s. (Seismologists often use the period to denote the low-frequency band, meaning 1/20.=0.05 Hz to 1/150.=0.0067 Hz). Missing data is filled up with 0.0. Each trace has been normalized by the maximum value of the whole trace so that the entire array value should be within the range of [-1.0, 1.0].
We also provide some useful scripts, i.e, requesting data from the IRIS data center, converting mseed data to binary data, and generating station and event catalog files. Please refer to the “useful_scripts” subfolder if you want to understand the data process in a broader aspect.
Basic problem (30 points): classification
We provide two typical seismic events, 537 normal earthquakes, and 347 glacial events. Of note, these two categories have been systematically analyzed, whereas the Volcano and Landslide are mostly individual studies. Feel free to use only part of the provided datasets or generate your own training, validation, and test data sets.
Your task is to design a learning method to distinguish Earthquake events from Glacial events or vice versa using the provided 2d image-like data.
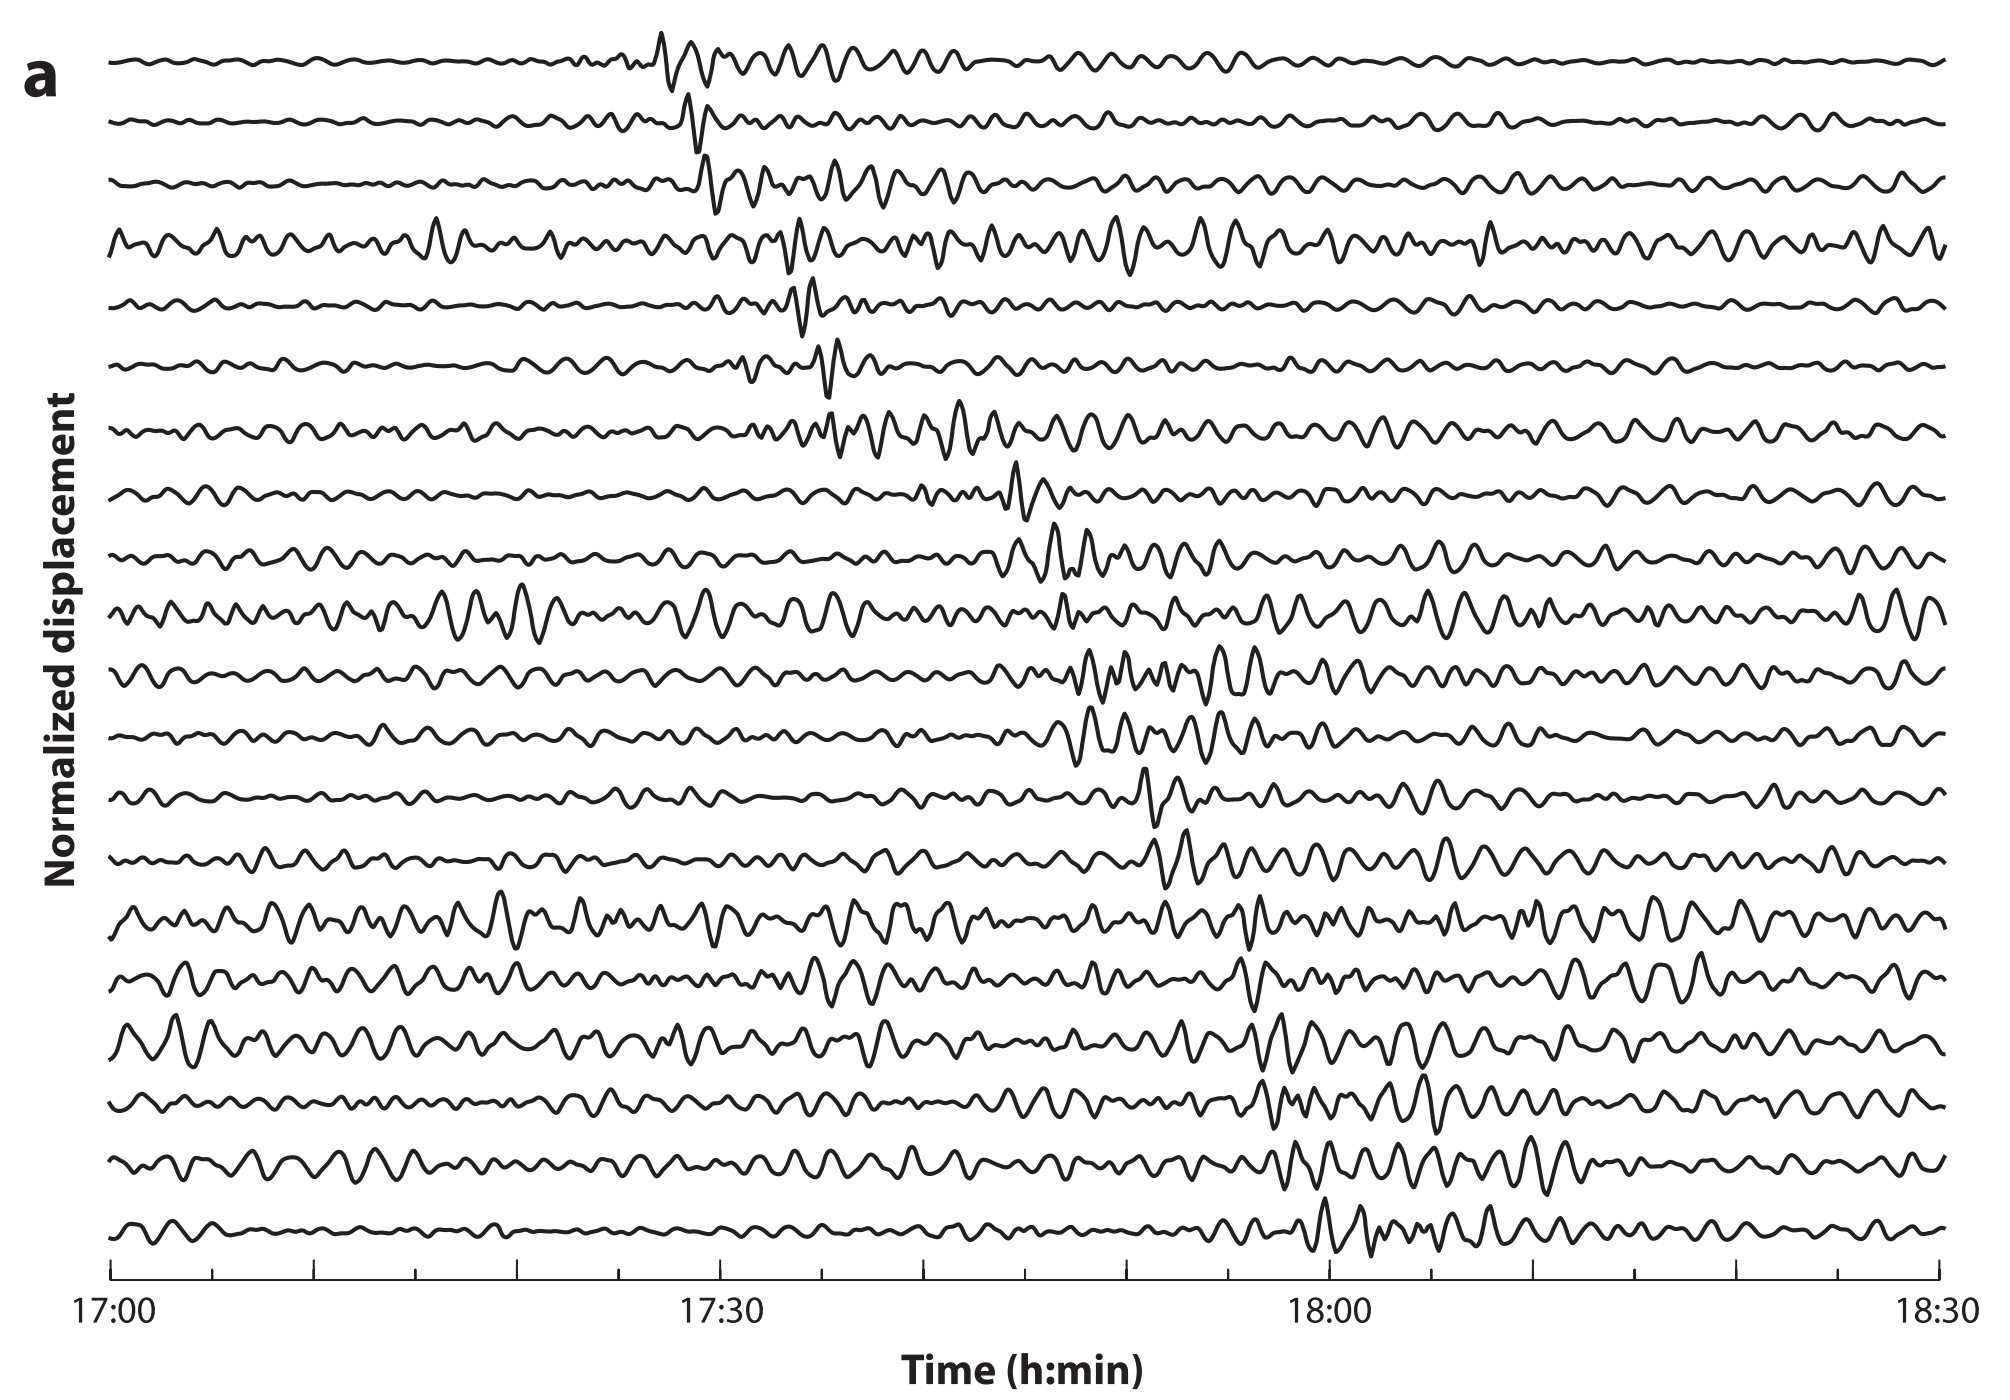
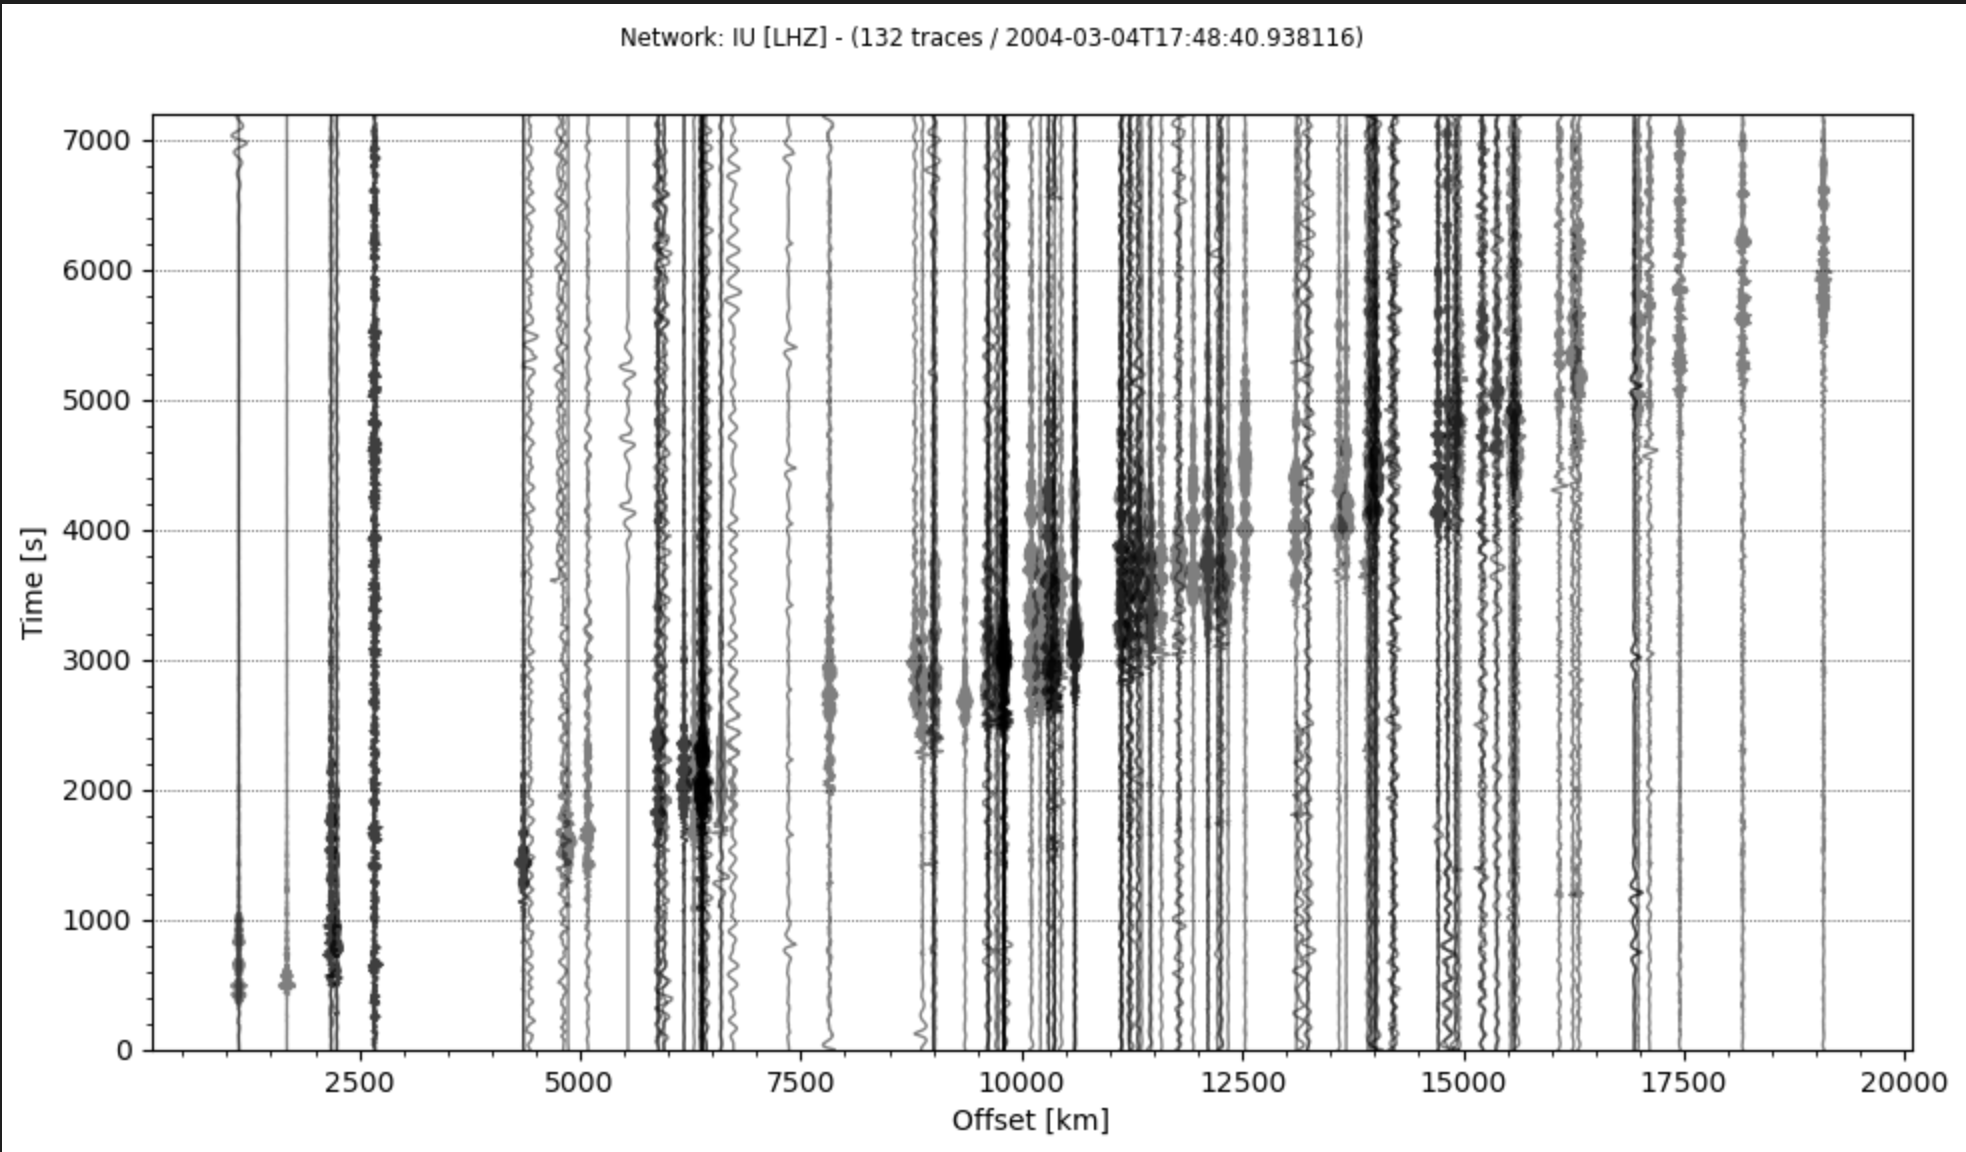
Below are some example seismogram plots of typical earthquakes.
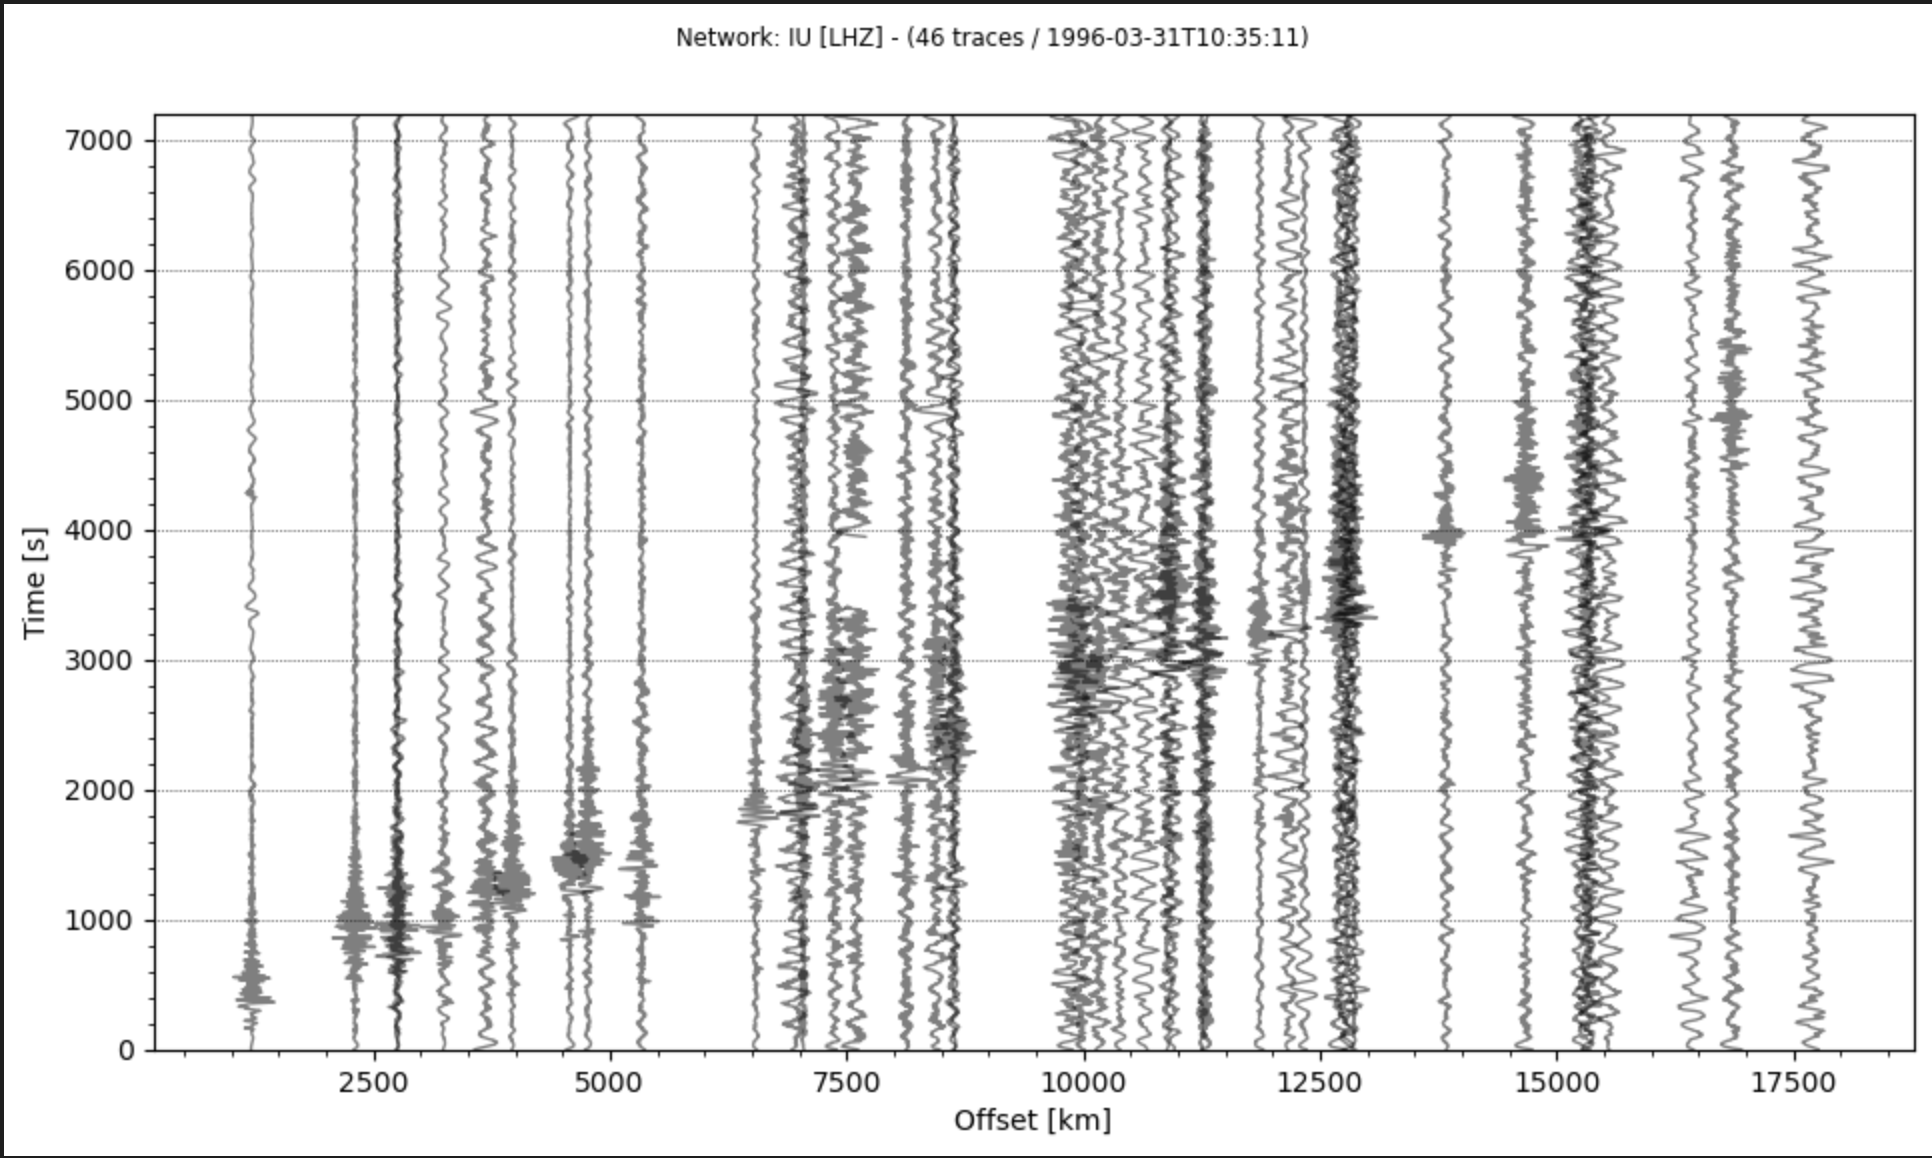
Below are some typical seismogram plots of glacial events:
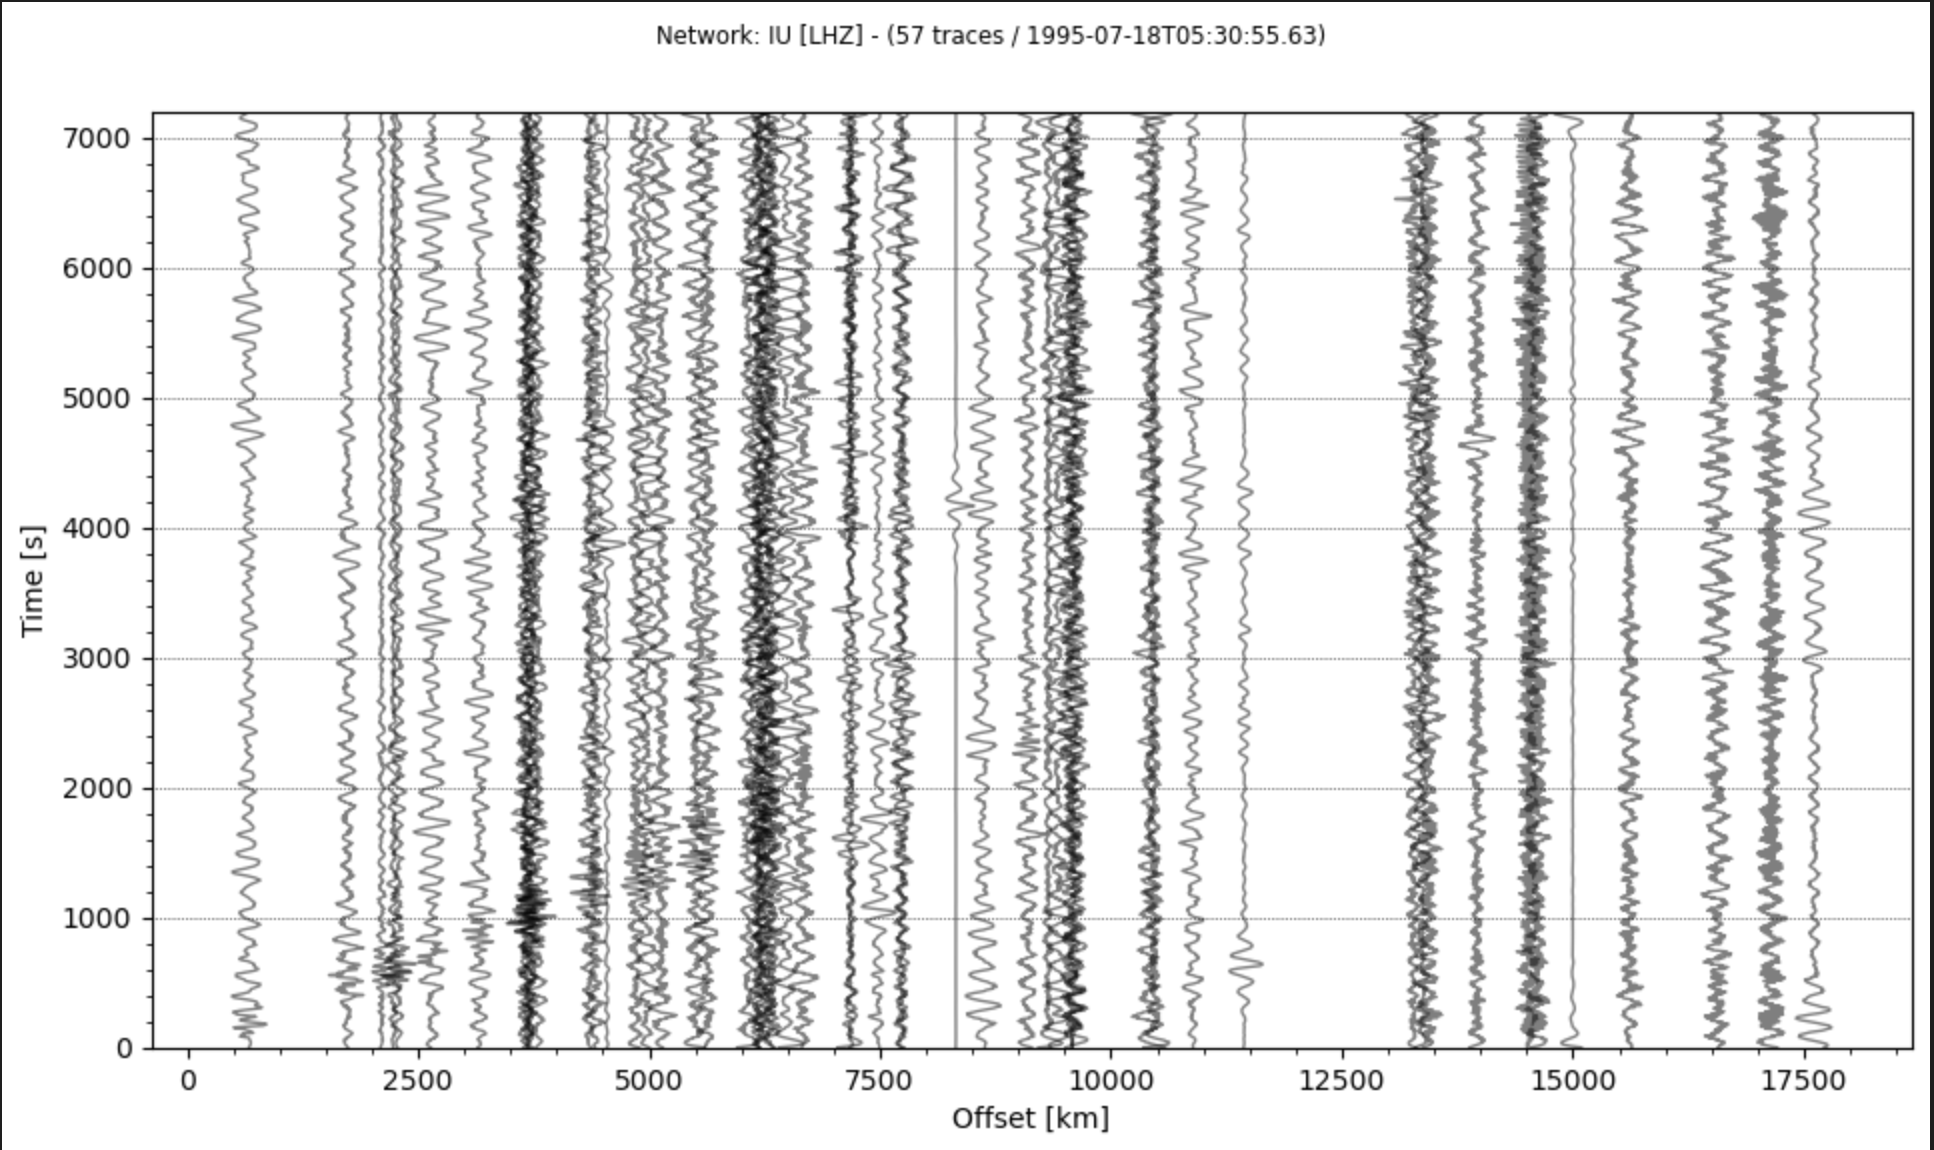
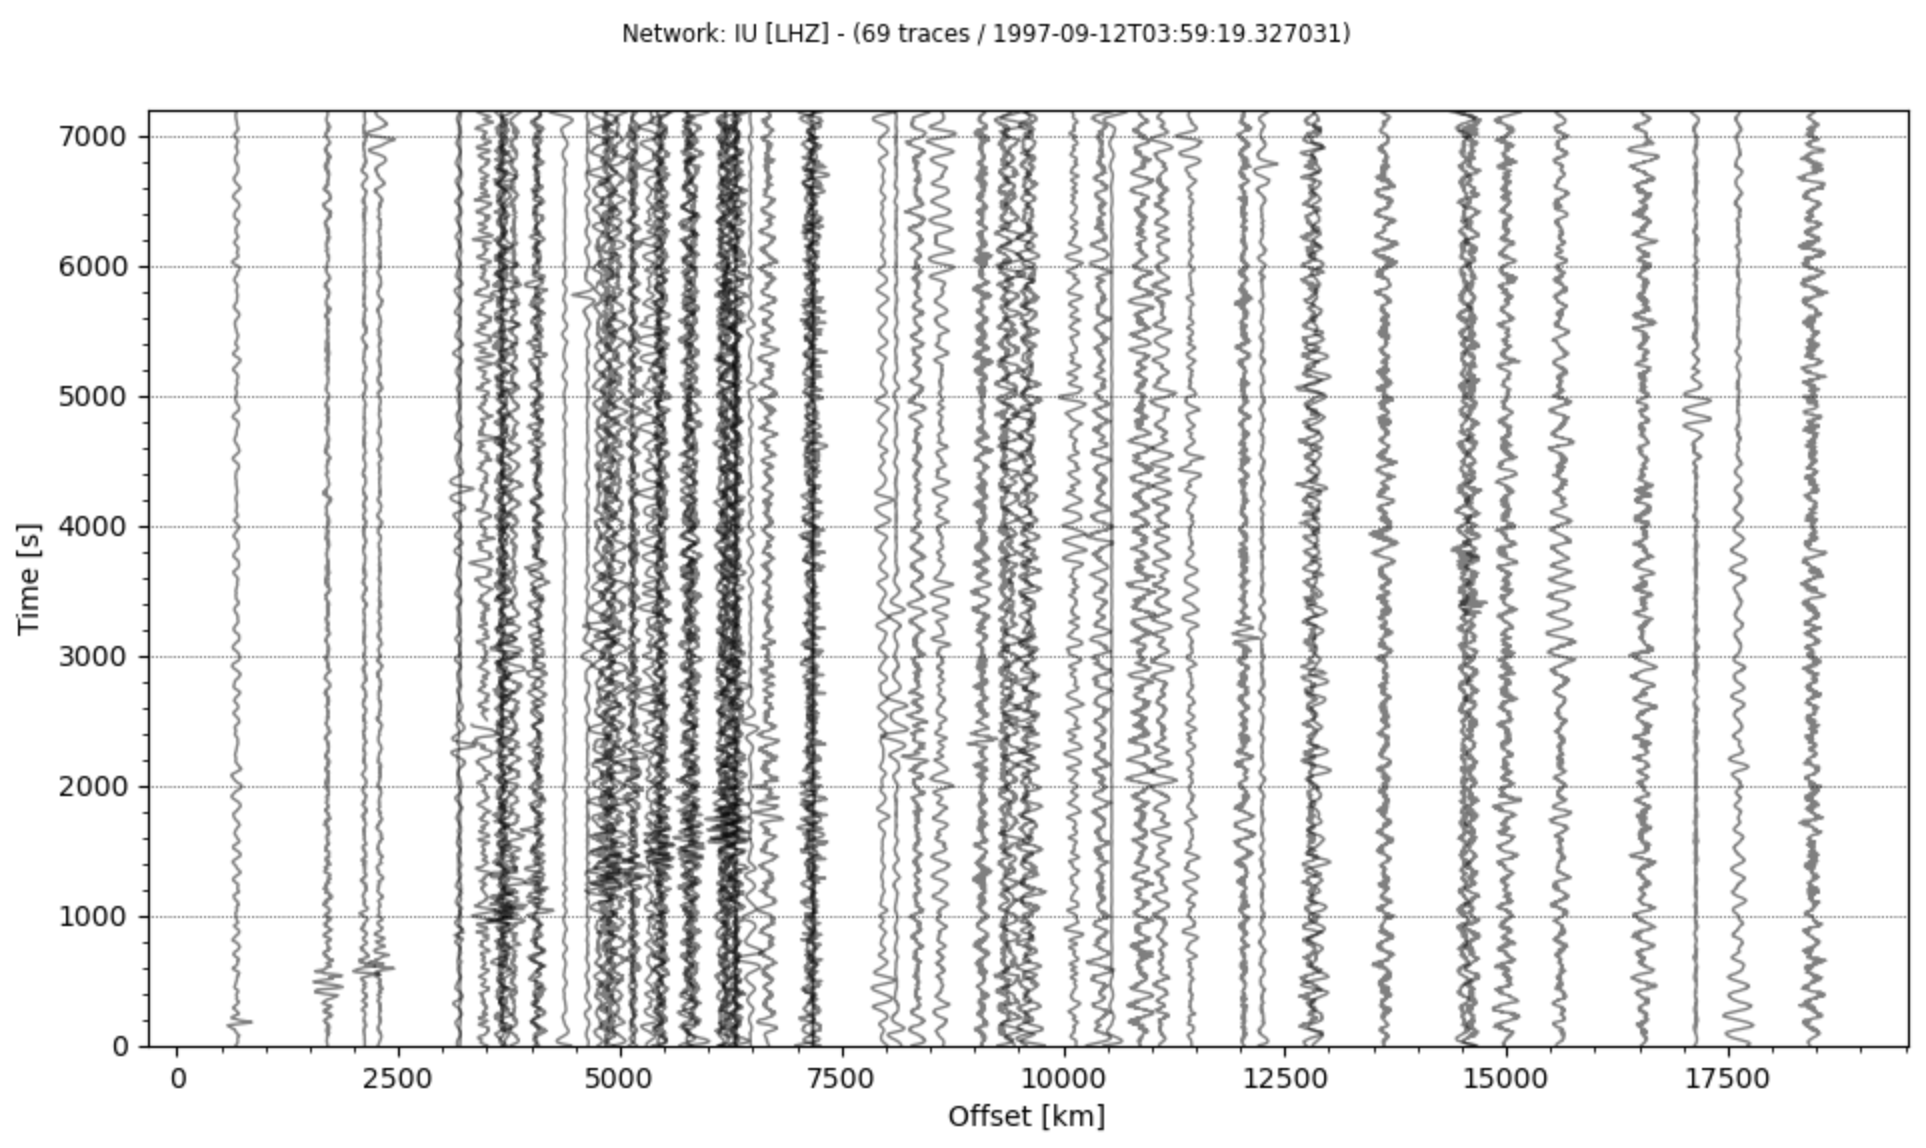
At first glance, you may find it easy to discern these figures. However, the binary data are stored at a fixed station index, which means the signal might in fact not be aligned perfectly as shown in the plot here. Of course, to generate these plots, we will have to use the information on the source location and the latitude and longitude of each station. Further, when considering the actual science application, we only have the real-time time flow of the network station waveform data. In most cases, we do not know each source’s location, depth, or magnitude parameters. And sometimes, the signals are pretty weak, and the signal-to-noise ratio is relatively low.
Bonus problems
Prediction (10 points)
Design a method to determine the source location, depth, and other source parameters from the given datasets. The source location, depth, and magnitude of each dataset are demonstrated in the txt catalog file (earthquake and glacial events separately).
It is getting slightly tricky here as the earthquake magnitude are not unified here: MW denotes “moment magnitude,” MB “body-wave magnitude,” and ms “surface-wave magnitude " in glacial events. We have normalized each trace for simplicity.
For regular earthquakes, your task is to determine the source latitude, longitude, and depth. Similarly, for glacial events, your task is to determine centroid latitude, longitude, and force azimuth (depth for glacial events is not necessary as we know that most glacial events happen on the Earth surface, 0km^^).
Ideally, you want to achieve a precision of 0.1-degree uncertainty to latitude and longitude, and 1 km to depth.
Anomaly detection (10 points)
A new catalog of anomaly seismic events can be detected (using the surface waves matching method, Göran et al, 2006); please refer to the data in the “unusual” subfolder. We know they are different from earthquakes but have no further information. Can you try to categorize the events and maybe learn some new patterns other than glacial events?
References
Nettles, Meredith, and Göran Ekström. “Glacial earthquakes in Greenland and Antarctica.” Annual Review of Earth and Planetary Sciences 38 (2010): 467-491.
Tsai, Victor C., and Göran Ekström. “Analysis of glacial earthquakes.” Journal of Geophysical Research: Earth Surface 112.F3 (2007).
Ekstrom, Goran, Meredith Nettles, and Geoffrey A. Abers. “Glacial earthquakes.” Science 302.5645 (2003): 622-624.
Ekström, Göran. “Global detection and location of seismic sources by using surface waves.” Bulletin of the Seismological Society of America 96.4A (2006): 1201-1212.